simple cloud solution
for data analysis
statplus.io is an online version of the StatPlus statistical package that allows users to perform various methods of data analysis. Whether you are an experienced user or just a beginner discovering statistics, statplus.io can make the data analysis easier.
Try for Free
Discover StatPlus-in-Cloud
Open up new features of the trusted app.
Straight out of the box with no need to configure.
Proven Methods at Your Fingertips
statplus.io comes with more than 80 analysis methods familiar from the desktop app (from the very basics to complex analysis, including non-parametric and regression analysis, survival and time series analysis, and a wide variety of other methods).
Reports are easy to understand and interpret, and look the same way as in the well-known desktop app, covered in books and papers.
Web App + Add-ons + More
Perform analysis in any modern browser on any platform, without installation of any software: macOS, Windows, Linux, Chrome OS, iOS, Android.
Use the add-ons to run data analysis directly from Excel (desktop, online, Excel for iPad) or Google Sheets.
Login with your statplus.io account to our desktop apps.
Low-Cost, High-Value
Desktop-grade features at a price that cannot be beaten. Want to save even more?
- Volume discounts are available for subscriptions with five or more seats.
- Universities or health care companies looking for remote learning solutions can enjoy heavily discounted customized plans.
- Save your time with a fast learning curve and run an analysis in a browser from any place.
- Get our new Excel add-in for no-hassle data analysis, directly from Excel without a need to run installers, download any extra components, or distribute a license among employees or students – on PC, Mac, iPad, or Office Online.
Make It Yours
We can solve your problems where off-the-shelf solutions do not fit requirements. Ask us to add an analysis method, a data connector, or make seamless integration with your apps and we would be glad to offer the made-to-measure solution at a price lower than other ready-to-use apps.
Special Offer: Get a subscription with multiple seats and we will customize the app at no extra cost. Offer also applies to universities and colleges using the app in a classroom without any seat requirement. Requests for new data analysis methods or options will be fulfilled on a priority basis.
Feeling unsure if StatPlus will fit your needs?
Ask usFeatures
statplus.io can complement the StatPlus app or serve as an understandable data analysis platform for users who have never used statistical software before.
Analysis Methods
Commands Out-of-Box
The free version includes all the Excel Analysis ToolPak commands with extra options and features.
Methods available as of today:
![]() basic methods and techniques of data exploration, hypothesis testing,
basic methods and techniques of data exploration, hypothesis testing,
![]() data processing and transformation tools,
data processing and transformation tools,
![]() analysis of variance (ANOVA),
multivariate analysis,
analysis of variance (ANOVA),
multivariate analysis, ![]() nonparametric statistics methods,
nonparametric statistics methods,
![]() regression analysis,
regression analysis,
![]() time series analysis and forecasting,
time series analysis and forecasting,
![]() survival analysis,
survival analysis,
![]() quality control tools and charts.
quality control tools and charts.
The number of methods is constantly growing. Thanks to our new platform and our experience, new features can be quickly delivered on your request.
Analysis Toolpak replacement
Upgrade Analysis ToolPak (Excel ATP)
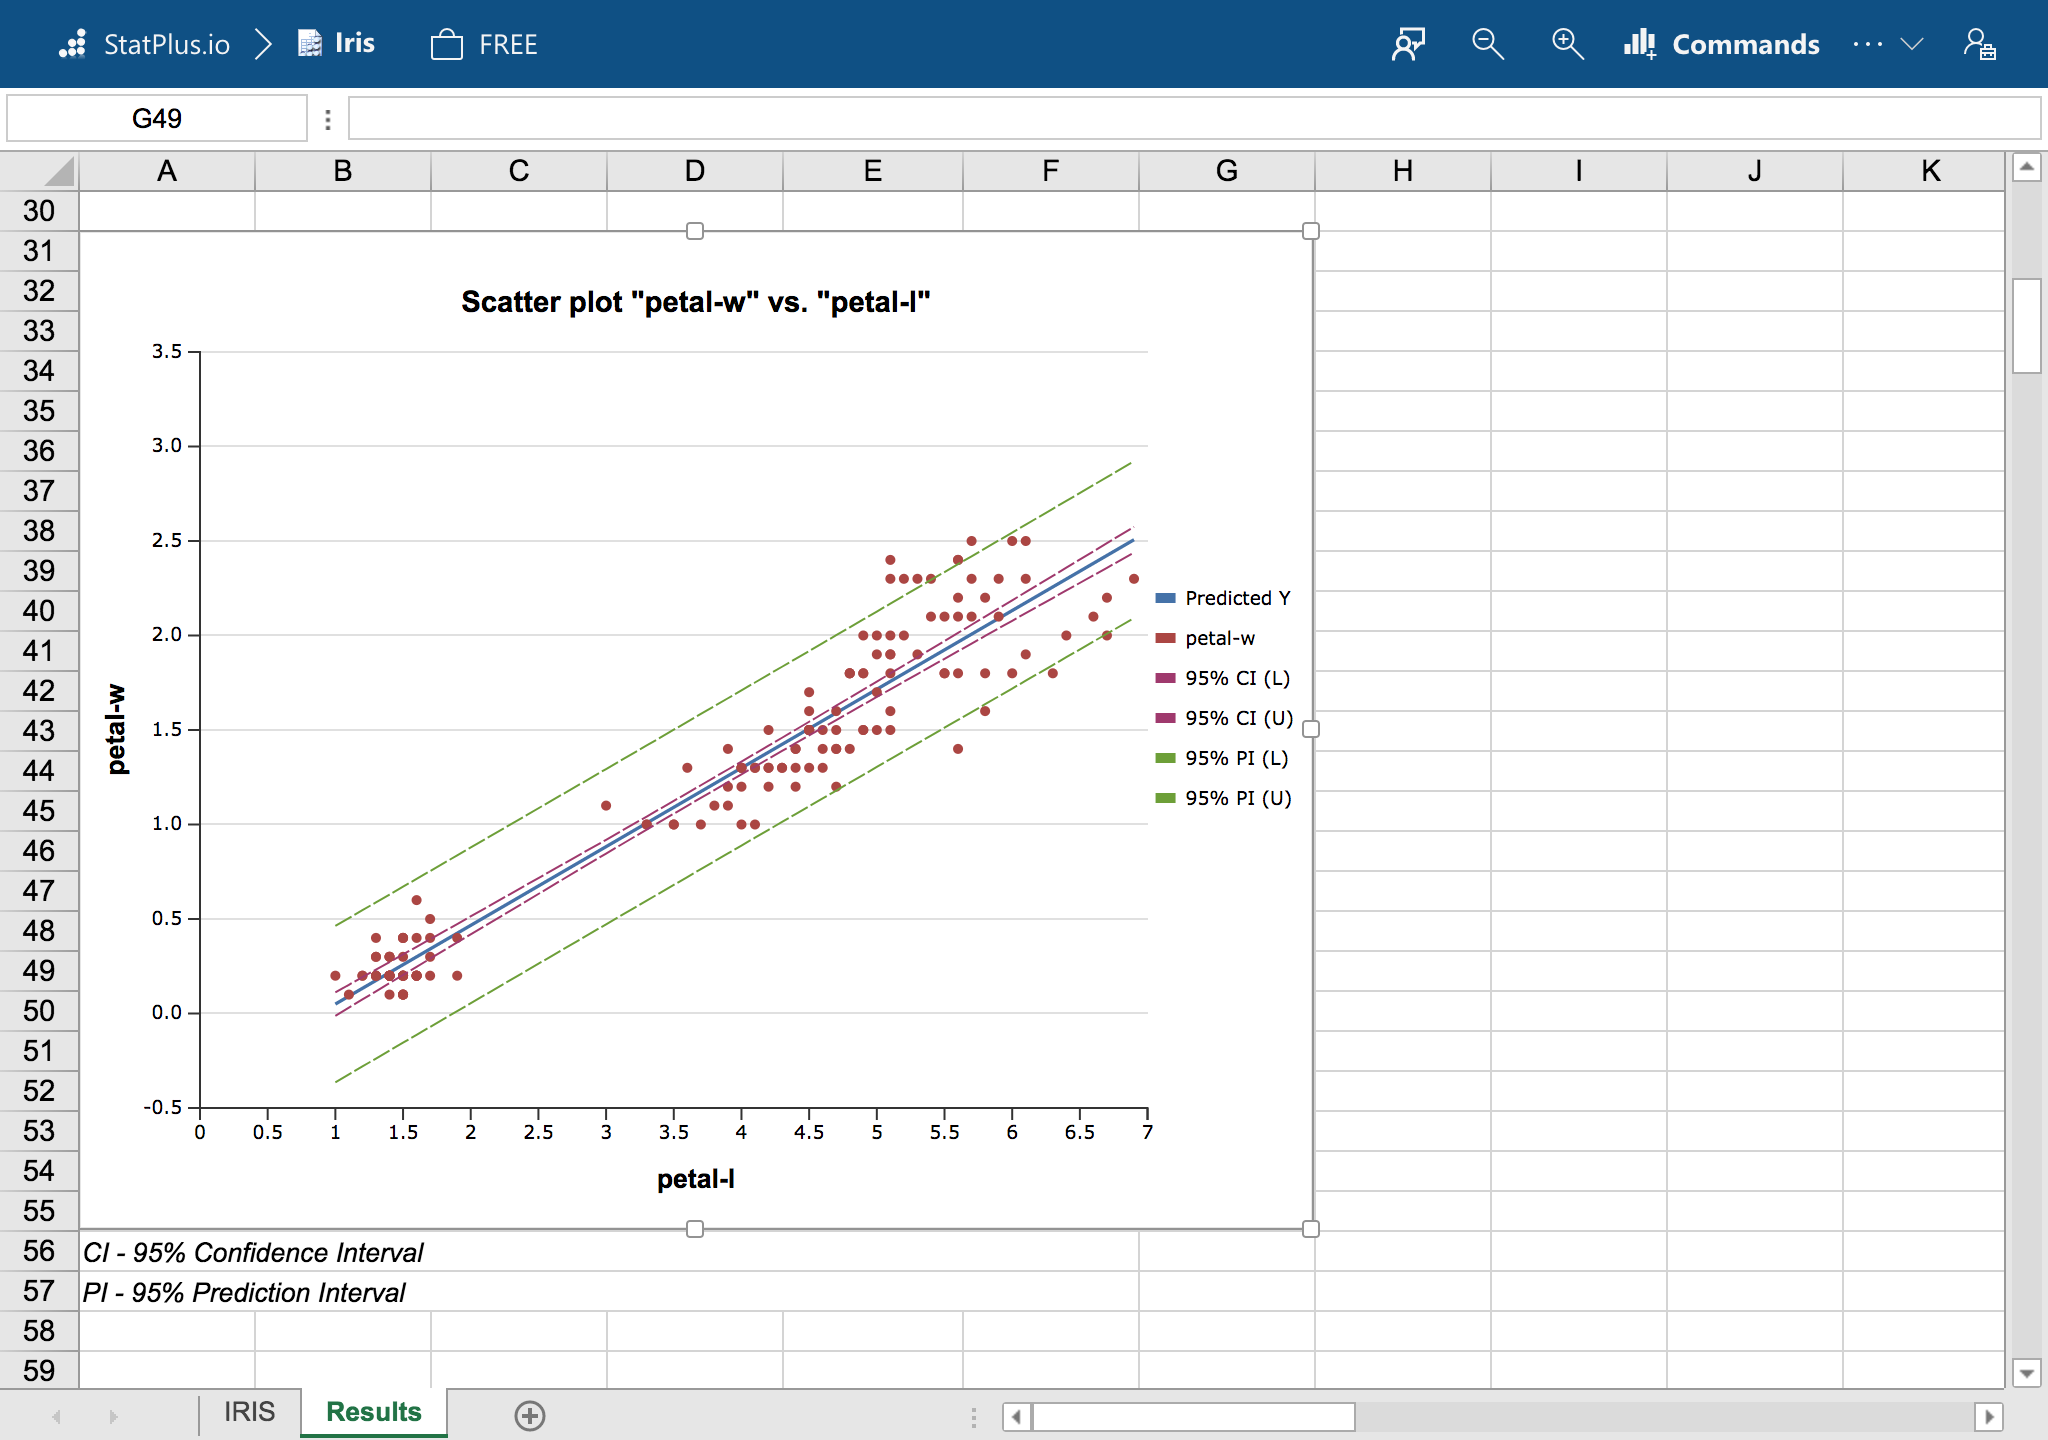
- Charts, like box-plots or scatterplots with ellipses, are available with any spreadsheet, from legacy Excel from the early 2000s (like Excel 2004) and up to the latest Office 365 (both desktop and online), Apple Numbers, or online spreadsheets.
- Draw scatter plots with confidence and prediction ellipses.
- Plot charts for levels of a categorical variable in one extra click.
- Adjust options to match results produced by Excel Analysis ToolPak (ATP), a legacy package like BMDP, or well-known but costly statistical software packages.
- Use nonparametric hypothesis testing methods when your real data cannot meet the assumptions required.
- Make hypothesis testing easier with plots for better visual exploration and p-values with a clear explanation if the hypothesis should be accepted or rejected.
- Use partial correlations to control for the effect of covariates.
- Get a comprehensive regression report that includes: residuals analysis, a bunch of plots for residuals (like Q-Q plot), a fitted model plot with confidence and prediction bands (for an univariate model), as well as multicollinearity and heteroscedasticity analysis results. Stay alert, control the collinearity.
Platforms and Add-ins
Platforms and Add-ins
Turn your spreadsheet into a statistical package.
Transform Excel
Run data analysis methods directly from the Excel app with the add-in that installs in one click on almost all platforms: Excel for Windows and Excel for Mac (supports Office 365 on both platforms), Excel Online, and Excel for iPad.
Desktop/Mobile Apps
Activate desktop and mobile apps with statplus.io account: StatPlus for Windows (standalone), StatPlus:mac (supports Excel 2019 and Apple Numbers) and StatPlus for iPad.

Google Sheets
Analyze your data directly from Google Sheets on your laptop or Chromebook.
Extensible
Extensible
See what we are working on next.
Data Connectors
Get your data in one place – import data from popular cloud services, spreadsheets, databases. Run analysis for data from multiple data sources and get a report delivered in a spreadsheet of your choice.
Data Refresh
Configure data to be refreshed to keep it up-to-date and deliver accurate results.
Pipeline
Create a pipeline to load, transform, and analyze data in one click.
Custom Scripts
Develop a custom data-analysis script that can be run from any supported spreadsheet.
Build-to-Order
Customized Solutions
We offer customized solutions to make your StatPlus experience simple and efficient. Ask us for a tailored solution that can cover all your needs and increase your efficiency and lower operating costs.
Integrations
Get a subscription with multiple seats and we will help to make a seamless integration with your apps at no extra cost. Offer also applies to universities and colleges using the app in a classroom without a seat requirement.
Pricing
Get a subscription with an early-bird discount up to a 50%.
No contract. No obligation. Cancel at any time.
Free
- Analysis ToolPak commands
- Excel add-in
- Google Sheets add-on
- Limit of 250 rows
- Limited storage
Pro
- Priority Support
- All the Basic, Data & Charts
- Regression models
- ANOVA & Multivariate analysis
- Non-parametric statistics
Premium
- All the Pro benefits
- Time series & Survival analysis
- Request a Feature
- Access to desktop Apps
- Assistance with integration